There are times when you may want to see how your score has trended from month to month or quarter to quarter.
To do this:
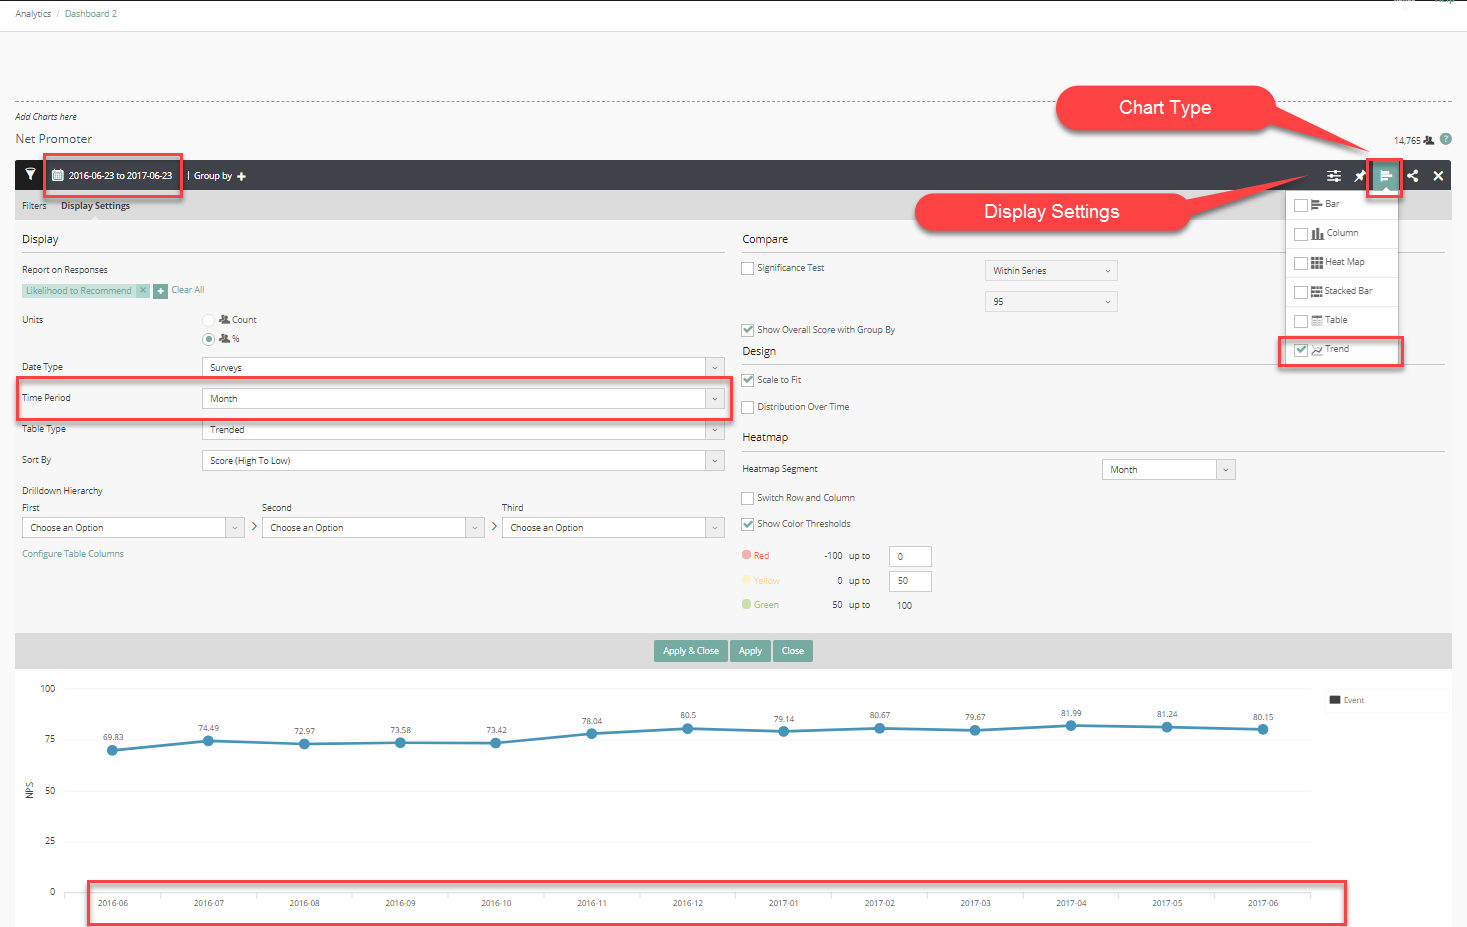
- Pull up your chart
- Select a date range that spans several months or the time period you wish to see
- Click the Chart Type icon
- Select the Trend chart
- Go to Display Settings
- Change the Time Period to Month (Also have options for Day, Week, Quarter, etc.)
You can also add events to your trend charts, which can explain what might have happened at different time points in your trend chart.
Comments
0 comments
Please sign in to leave a comment.